
Chapter 10: Quality & Acceptance
Image quality standards, recognition accuracy benchmarks, and formal acceptance testing procedures
10.1 Image Quality Comparison
Image quality is the single most important determinant of LPR recognition accuracy. The quality comparison image below illustrates the difference between acceptable and unacceptable plate images across five key quality dimensions: exposure, focus, motion blur, angle, and resolution. Understanding these quality dimensions is essential for both system design and acceptance testing.
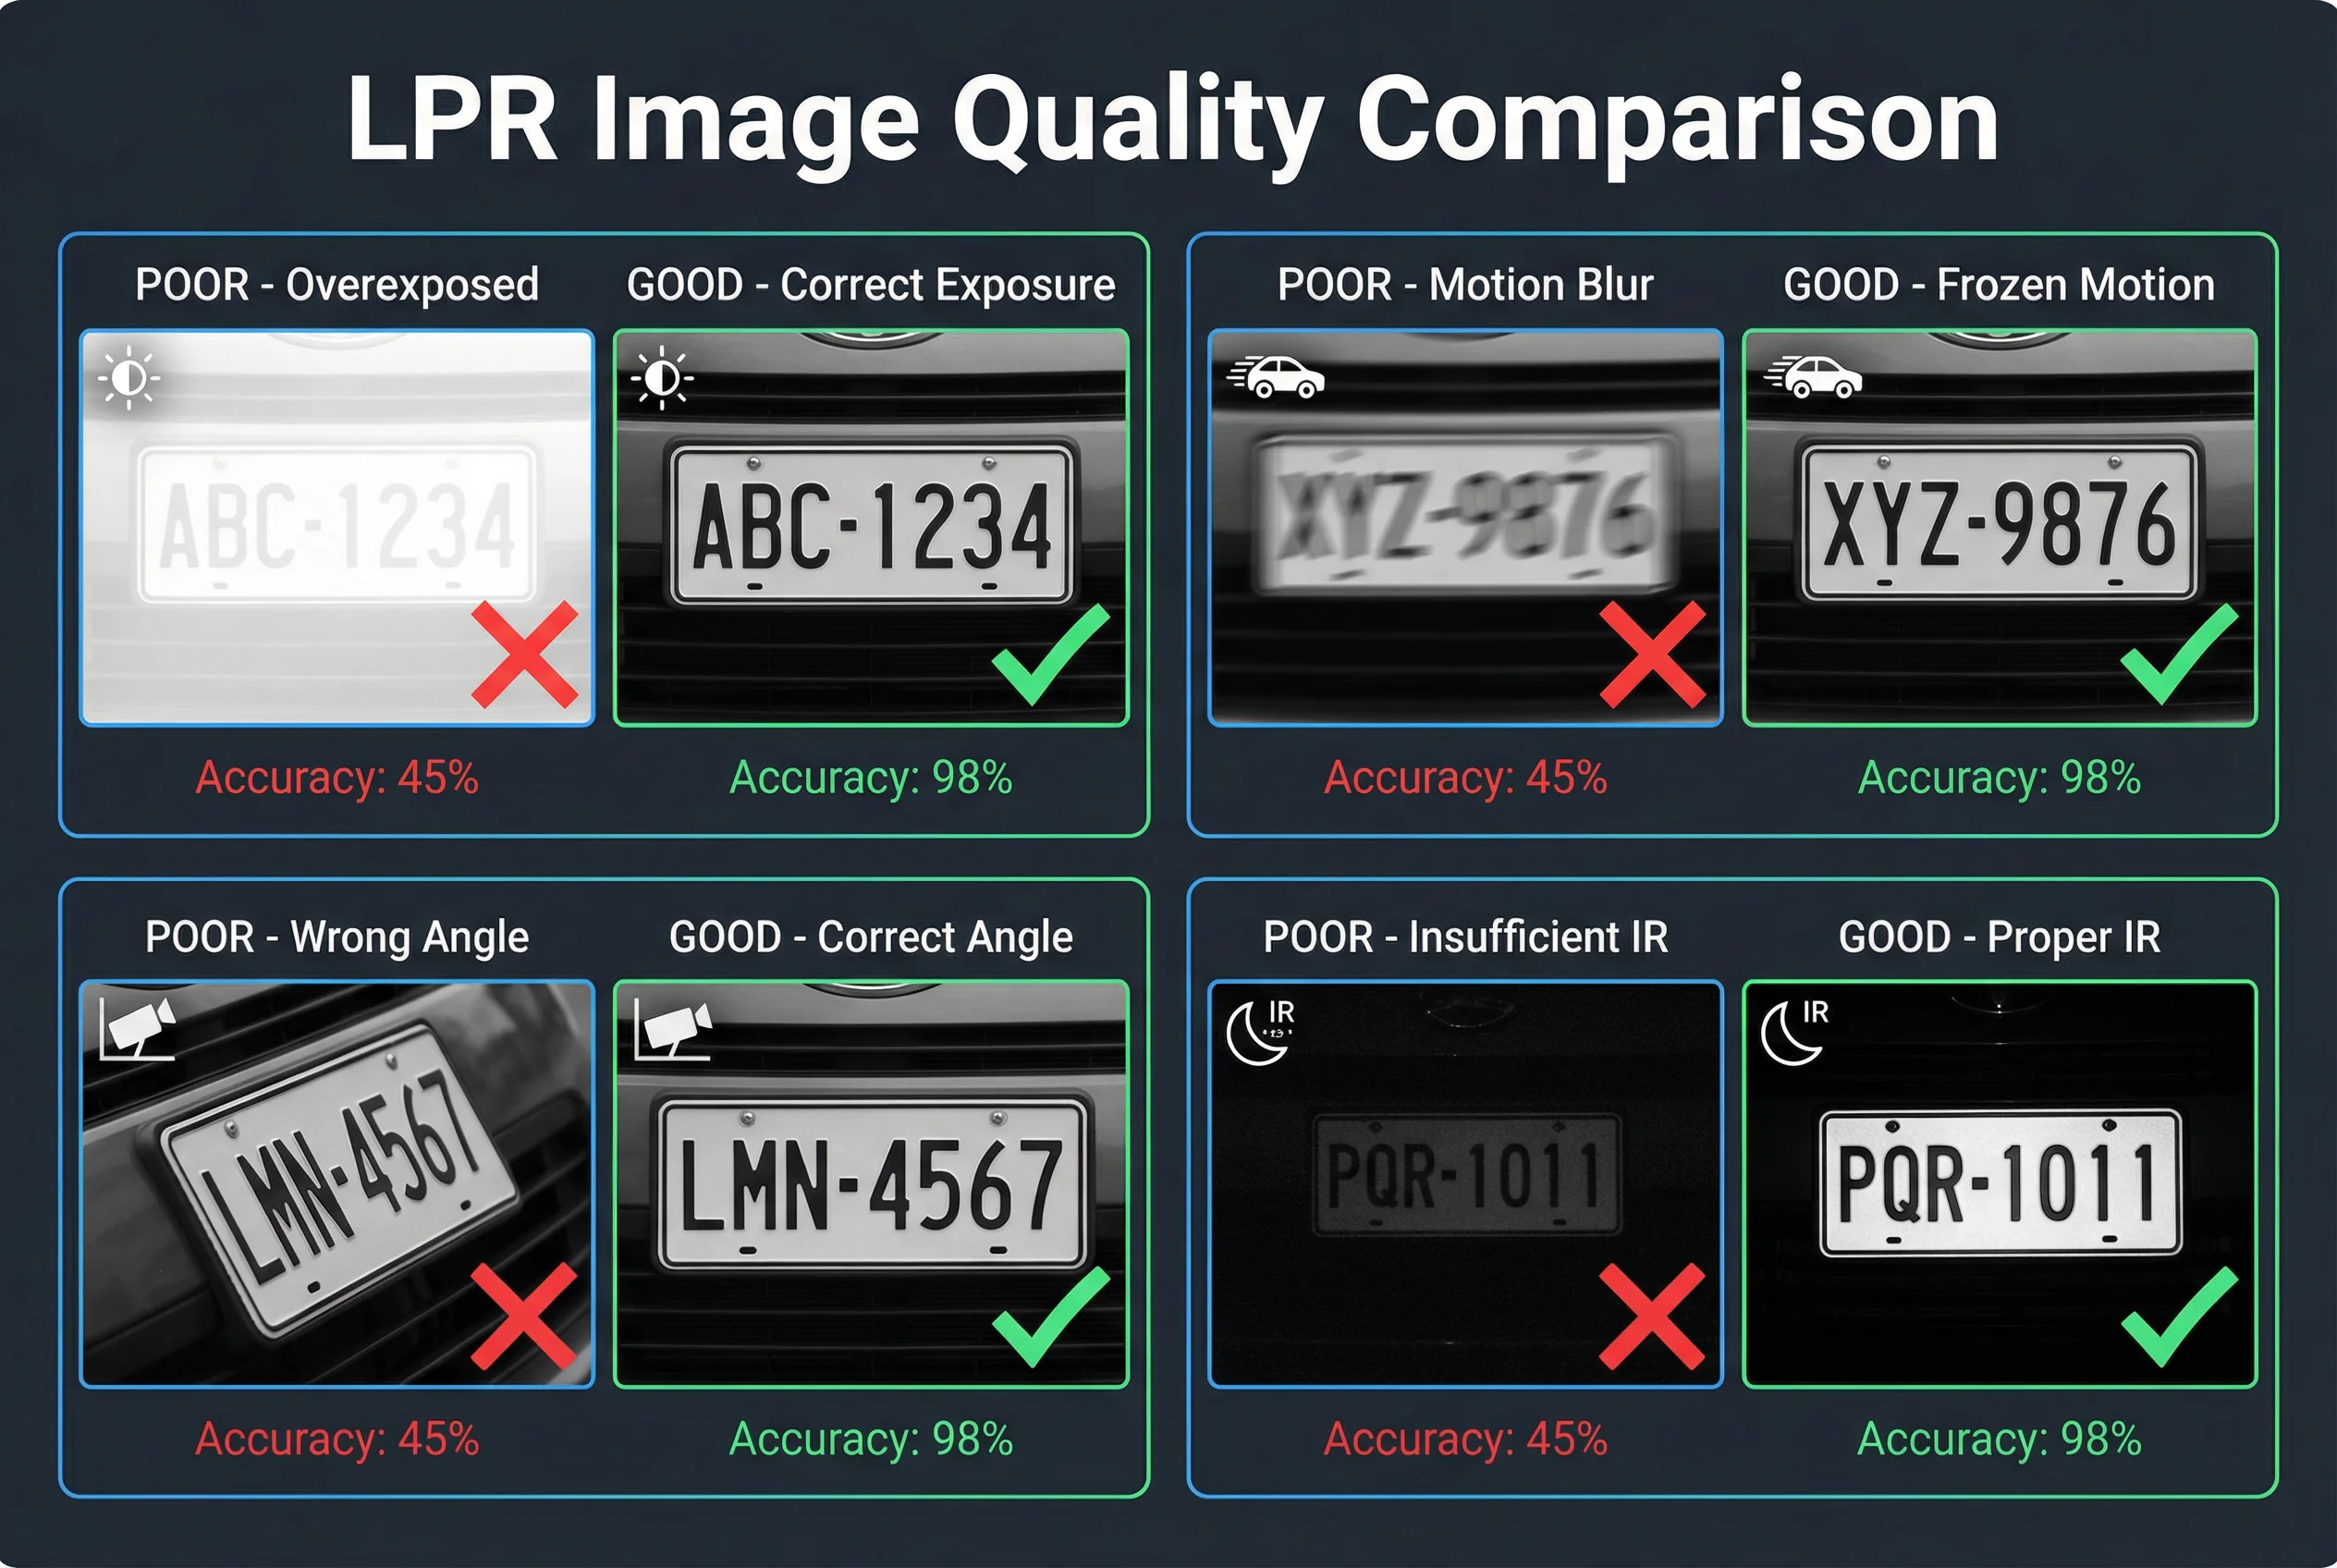
Figure 10.1: LPR plate image quality comparison — acceptable vs. unacceptable across exposure, focus, blur, angle, and resolution dimensions
The quality comparison reveals that the most common failure modes in LPR systems are not hardware failures but configuration errors: incorrect exposure settings causing overexposed plates in daylight, insufficient shutter speed causing motion blur at high vehicle speeds, and incorrect focal length causing under-resolved plate images. All three failure modes are preventable through proper system design and commissioning.
10.2 Image Quality Standards
The following table defines the quantitative image quality standards that must be met for LPR system acceptance. These standards apply to all capture conditions (day, night, adverse weather) and must be verified using a standardized test vehicle with a known plate at the defined capture point.
| Quality Dimension | Measurement Method | Minimum Standard | Target Standard | Failure Condition |
|---|---|---|---|---|
| Plate Pixel Width | Count pixels across plate width in captured image | ≥140 px | ≥200 px | <120 px |
| Plate Brightness | Average pixel value of plate region (0–255) | 100–200 | 130–180 | <80 or >220 |
| Contrast Ratio | Plate character vs. background luminance ratio | ≥3:1 | ≥5:1 | <2:1 |
| Motion Blur | Edge sharpness measurement (MTF at Nyquist) | ≥0.4 MTF | ≥0.6 MTF | <0.3 MTF |
| Horizontal Angle | Angle between camera optical axis and plate normal | ≤30° | ≤20° | >35° |
| Vertical Angle | Camera elevation angle relative to plate | ≤25° | ≤15° | >30° |
| Image Noise | Signal-to-noise ratio in plate region | ≥30 dB SNR | ≥40 dB SNR | <25 dB SNR |
| Focus Quality | Laplacian variance of plate region | ≥100 | ≥200 | <50 |
10.3 Recognition Accuracy Testing
Recognition accuracy testing must be conducted under standardized conditions using a representative sample of vehicles. The test protocol requires a minimum of 1,000 vehicle passes per condition (day, night, adverse weather) with a known ground truth plate database. Results must be reported separately for each condition and must meet the minimum accuracy thresholds defined in the project specification.
| Test Condition | Min. Sample Size | Min. Accuracy | Target Accuracy | Max. False Positive Rate |
|---|---|---|---|---|
| Daytime, clear weather, ≤80 km/h | 1,000 passes | 98% | 99.5% | 0.1% |
| Nighttime, clear weather, ≤80 km/h | 500 passes | 95% | 98% | 0.2% |
| Daytime, rain/fog, ≤60 km/h | 200 passes | 90% | 95% | 0.5% |
| High speed (80–120 km/h), daytime | 500 passes | 97% | 99% | 0.2% |
| Dirty/damaged plates | 100 passes | 80% | 90% | 1.0% |
| Foreign/non-standard plates | 100 passes | 85% | 92% | 0.5% |
10.4 Formal Acceptance Testing Procedure
The formal acceptance test must be conducted by an independent third party (or jointly by the client and contractor) following the procedure below. All test results must be documented and signed by both parties. Any test that fails must be remediated and re-tested before final acceptance is granted.
- 1
Pre-Test Verification
Verify all hardware is installed per design drawings. Check all cable connections, power supply voltages, and network connectivity. Confirm all software is at the approved version. Document serial numbers of all installed equipment.
- 2
Image Quality Assessment
Capture test images at each lane under day and night conditions. Measure plate pixel width, brightness, contrast, blur, and angle for each image. Compare against quality standards table. Adjust camera settings if any parameter fails.
- 3
Recognition Accuracy Test
Conduct minimum sample passes per condition as defined in the accuracy testing table. Record all recognition results against ground truth. Calculate accuracy, false positive, and false negative rates. All results must meet minimum thresholds.
- 4
Integration Verification
Verify all downstream integrations (access control, PMS, billing, etc.) receive correct data within defined latency SLAs. Test error handling and retry logic by simulating downstream system failures. Verify audit logs are complete and tamper-evident.
- 5
Performance and Load Test
Simulate peak traffic conditions (maximum vehicles per hour per lane). Verify system maintains accuracy and latency SLAs under load. Test failover behavior by simulating component failures. Verify recovery time meets defined RTO.
- 6
Security and Compliance Verification
Verify all security controls from Chapter 6 are implemented. Conduct basic penetration test of network interfaces. Verify data retention and deletion policies are configured correctly. Review audit log completeness.
- 7
Documentation Review and Sign-Off
Review all as-built documentation for completeness and accuracy. Verify all test results are documented and signed. Issue formal acceptance certificate if all tests pass. Define remediation plan for any outstanding issues.